The latest version of HadISD has been made available on the hadobs website. This version (v1.0.2.2013f) supercedes the preliminary version from earlier this year (v1.0.2.2013p). There were further updates to the ISD source data for the year 2013 since the preliminary dataset was created in January, but no changes in earlier years.
Extra variables have been pulled through from the ISD source data in this release, but these have not been quality controlled. They are wind gust and precipitation period. As these were not quality controlled there has been no further increment of the version number. If you use these variables then be aware that they are provided as is, with no guarantee as to their quality.
As always, if you find anything untoward in the data, please contact the dataset maintainers.
Tuesday, 29 April 2014
Monday, 14 April 2014
First steps in homogenising HadISD
Having done the second annual update to HadISD in January this year (to version 1.0.2.2013p), we have started the process of homogenising the dataset. The issue of homogenising hourly data (applying the adjustments to the data) is something that has not yet been fully solved. Monthly homogenisation has been used for a while now, and there has been at least one benchmarking study to assess the accuracy and precision of the different available algorithms (Venema et al 2012). Solving the problem of daily homogenisation has been started by some groups, but my impression is that these have been for small, regional networks of stations and also involved a relatively large amount of manual intervention. I am open to suggestions of algorithms and studies that I have missed.
In the light of these issues, rather than trying to solve the problem of automated, hourly homogenisation in one step, we shall start by releasing the homogeneous sub-periods for each station in the dataset. However this means that the users will need to decide what to do with this information. For example, each sub-period could be treated separately or stations with few/small breaks could be given a greater weighting than those with many/large breaks in any analysis.
As HadISD contains 6103 stations, we have had to use methods and scripts which allow for a completely automated system. This has the advantage that the results are completely reproducible and objective, even if a system which includes some manual checking might be better in some situations.
We have chosen to use the Pairwise Homogenisation Algorithm (PHA) used for the US Historical Climate Network (USHCN) by Menne & Williams (2009). Kate Willett has already used this for her HadISDH dataset (Willett et al. 2012) and is using it for the extension to other humidity variables (for more details see http://hadisdh.blogspot.co.uk). We could therefore be certain that this system would run on the data automatically and be quick enough to be of use. Alternative systems were considered (e.g. SPLIDHOM/HOMER, ACMANT, MASH) but none of these were suitable either because of the computer operating systems available or because of the level of manual intervention required. This was a shame, as a comparison between two or more systems would have given some level of confidence on the breaks found. Perhaps something for the future.
Networks and Averages
When starting the homogenisation process with PHA, we found that the results were sensitive to the station network used. Small changes in the neighbour selection and also the individual monthly values would mean that change points were or were not found in target stations. Hence we initially decided to use four different networks, comprising of stations with more than 30, 20, 10 and zero years of data (the final network contains all 6103 stations). PHA was run using each of these networks separately.
Initially only monthly average data were used, calculated from daily averages. These are calculated for all days which have more than four observations spread over at least a 12 hour time-span. Monthly means were calculated for all months with at least 20 qualifying days. However, Wijngaard et al. (2003) showed that change points were clearer when using the monthly average diurnal temperature range. Also, monthly average maximum and minimum temperatures were used by Trewin (2013) when homogenising the Australian Climate Observations Reference Network - Surface Air Temperature (ACORN-SAT). Using these measures could identify change points where the maximum or minimum temperatures change but the means remain unchanged.
We initially tried to use all four different measures (mean, diurnal range, maxima and minima) as well as the four different network types, resulting in 16 PHA runs for each variable (temperature, dewpoint temperature, sea-level pressure and wind speeds). Change points were merged if they occurred within one year of one another, and the average date was used. The final set of change points were those which were identified in at least two of the 16 methods.
Although using all these methods and networks may compensate for the conservative nature of PHA (Venema et al. 2012), this approach was biased to selecting change points in stations with longer records. If a change point is detected 50% of the time by any of the PHA runs, then it is likely to appear 8 times overall for a station with a long record, but only once for a station with a short record, and hence fail to meet the selection criteria in the short station, but be selected in the longer station.
We therefore reduced the complexity to use only the complete network of 6103 stations, and only the mean and diurnal range (temperature and dewpoint), mean and maximum (wind speeds) or mean only (SLP). If change points were within one year of one another, they were merged. Naturally this reduced the number of change points detected. However, despite not applying adjustments to the data, we do not want to make the data worse. This approach is less likely to include spurious change points in the final lists then if using the combination of all 16 methods.
Final Methology
The most important change points are those with the largest adjustment values, which should be detected in this simpler analysis as well as in the more complex one. The change points with the smallest adjustment values are difficult to detect using any of the methods, resulting in the characteristic "missing middle" when showing the distribution of adjustments (Fig. 1). Assuming that the Gaussian envelope is an accurate representation of all adjustments in HadISD, then PHA has identified most down to a limit of around 0.5C, with no strong bias in the distribution.
 |
| Fig. 1 Distribution of adjustment sizes for the monthly average temperatures. The raw adjustments are shown in black, with a fitted Gaussian in red. The difference between this Gaussian and the detected adjustments is shown by the blue histogram. |
Unsurprisingly, the longer the station record, the more change points are detected, with on average 2.8 per station over 41 years (roughly one every 15 years), but four stations have 11 change points (Fig. 2).
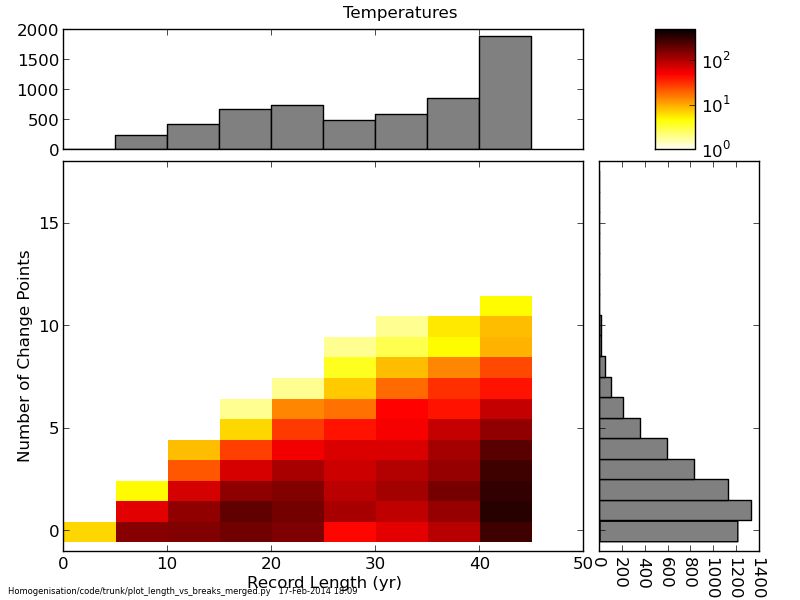 |
| Fig. 2. The distribution of the number of change points with the length of the station record. |
In due course, the change point dates and adjustment sizes (which have not been applied to the data) will be made available on the HadISD website.
The paper describing the final methodology in detail, and also the characteristics of the change points in the dewpoint temperature, sea-level pressure and wind speed observations is now under open review with Climate of the Past: http://www.clim-past-discuss.net/10/1567/2014/cpd-10-1567-2014.html
References
Menne, Matthew J., and Claude N. Williams Jr. "Homogenization of temperature series via pairwise comparisons." Journal of Climate 22.7 (2009): 1700-1717.
Trewin, B.: A daily homogenized temperature data set for Australia, International Journal of Climatology, 33, 1510–1529, 2013.
Venema, V., Mestre, O., Aguilar, E., Auer, I., Guijarro, J. A., Domonkos, P., Vertacnik, G., Szentimrey, T., Stepanek, P., Zahradnicek, P., et al.: Benchmarking homogenization algorithms for monthly data, Climate of the Past, 8, 89–115, 2012.
Wijngaard, J., Klein Tank, A., and Koennen, G.: Homogeneity of 20th century European daily temperature and precipitation series, International Journal of Climatology, 23, 679–692, 2003.
Willett, Kate M., et al. "HadISDH: an updateable land surface specific humidity product for climate monitoring." Climate of the Past 9.2 (2013): 657-677.
Monday, 7 April 2014
Low windspeeds in Irish stations
Thanks to Clive Wilson (Met Office) for informing us that the wind speeds in the Irish stations between July 1996 and August 1998 are lower than the surrounding years. An example is shown in Fig 1. for Dublin.
Of the 14 Irish stations in HadISD, 12 have continuous data across this period (039520-99999 Roches Point and 039700-99999 Claremorris have no or sporadic data only across this period). Most of the periods are identified using the PHA homogenisation algorithm that we are in the process of applying to HadISD.
The affected stations are:
039530 99999 VALENTIA OBSERVATORY
039550 99999 CORK AIRPORT
039570 99999 ROSSLARE
039600 99999 KILKENNY
039620 99999 SHANNON AIRPORT
039650 99999 BIRR
039670 99999 CASEMENT AERODROME
039690 99999 DUBLIN AIRPORT
039710 99999 MULLINGAR
039740 99999 CLONES
039760 99999 BELMULLET
039800 99999 MALIN HEAD
For the moment we advise users of HadISD to be cautious when using wind speed data for these stations over this period. We are investigating the cause of this low period with the maintainers of the ISD at NCDC and will update this post when we have more information.
 |
Fig. 1 - Wind speeds for Dublin (039650-99999). The vertical lines are change points detected on a monthly basis using the PHA algorithm of Menne & Williams (2009). There is a change in resolution in the middle of 1998 coinciding with the change point. |
Of the 14 Irish stations in HadISD, 12 have continuous data across this period (039520-99999 Roches Point and 039700-99999 Claremorris have no or sporadic data only across this period). Most of the periods are identified using the PHA homogenisation algorithm that we are in the process of applying to HadISD.
The affected stations are:
039530 99999 VALENTIA OBSERVATORY
039550 99999 CORK AIRPORT
039570 99999 ROSSLARE
039600 99999 KILKENNY
039620 99999 SHANNON AIRPORT
039650 99999 BIRR
039670 99999 CASEMENT AERODROME
039690 99999 DUBLIN AIRPORT
039710 99999 MULLINGAR
039740 99999 CLONES
039760 99999 BELMULLET
039800 99999 MALIN HEAD
For the moment we advise users of HadISD to be cautious when using wind speed data for these stations over this period. We are investigating the cause of this low period with the maintainers of the ISD at NCDC and will update this post when we have more information.
Subscribe to:
Comments (Atom)