Tuesday, 7 October 2025

HadISD v3.4.3.2025f - the final release

In order to wrap up the HadISD dataset nicely, I decided that doing an official final version could be useful.  So that it has the largest possible number of stations, I also re-selected stations for this release, hence the extra increase in version number. There are 10405 stations in this final version of the HadISD - v3.4.3.2025f.  

Fig 1: Location of stations in HadISD v3.4.3.2025f
 

Usually I would redo the station selection in February of a calendar year, having done the final release of a previous version and the associated homogeneity assessment in early January.  However as I'm not expecting any further updates to the ISD, it made sense to roll this all into one.  Hence, I have also run the homogeneity assessment for version v3.4.3.2025f.

In due course these this dataset will be archived on the CEDA Archive. 

This dataset has been part of my work for the last 15 years, and although sad to see it finish, I'm also excited to see what the future will bring with GHCNh/C3S In Situ Observations


Thursday, 4 September 2025

HadISD v342_202508p - potentially the final release

As of August 29th 2025, the ISD dataset has stopped receiving updates.  Therefore the HadISD can no longer append new data to the end of the station time series.


Screenshot of NOAA/NCEI announcement
Snapshot on 4th September 2025 of this page: https://www.ncei.noaa.gov/operating-system-upgrade-outage


Given the timing of this change, we have released v342_202508p as normal as a standard "preliminary" version using the station lists from January 2025.  In due course, we shall see if or how best to release a 2025f version.

But for now, the HadISD dataset is coming to the end of its run.  Version 1.1.0.2011f was released in 2012, as an annually updating dataset covering 1st January 1973 to 1st January 2012 with 6103 stations.  Version 3.4.2.202508p is a monthly updating dataset covering 1st January 1931 to 29th August 2025 with 10,269 stations.

As a replacement, the Global Historical Climatology Network hourly (GHCNh) has built on the successes and developments within HadISD.  GHCNh is still under active development, and so will improve over the coming years to fill the gap that ISD/HadISD will leave.

Friday, 7 February 2025

HadISD v3.4.2.202501p

As the ISD is still currently being updated, we have made the first annual update for 2025, v3.4.2.202501p.  As usual, we've re-run the station selection and now there are 10,276 stations in the dataset.

This update was run on a new compute solution, but a comparison to a version run on the old one showed only very minor changes for the Distributional Gap and Climatological checks - which are likely to have arisen in the Gaussian curve fitting for these tests.  Only a few stations have moved flagging categories in the summary plots, and only for these tests and those which assess overall flagging rates (month-clearing).  We have therefore accepted the migration as successful with no changes made to the underlying code.

Thursday, 5 December 2024

HadISD v3.4.1.202411p; Precipitation values; GHCNh

We have just released v3.4.1.202411p of HadISD.  The ISD is still being updated at NOAA, and we hope to release the v3.4.1.2024f update early in January 2025.

We have also been made aware that as a result of how we prioritise different messages in the ISD, not all precipitation reports are present in the HadISD.  The ISD has a number of sub-daily message types (e.g. FM-12, FM-15, FM-16 etc) stored to minute-precision.  When selecting observations for the HadISD, we do not take all possible entries in the ISD, but prioritise those which contain Temperature or Dew Point Temperature values.  To quote from Dunn et al, 2012:

As both temperature and dewpoint temperature are required to be measured simultaneously for any study on humidity to be reliably carried out, reports that have both temperature and dewpoint temperature observations are favoured (under the assumption that the readings were taken at close proximity in space and time) over those reports that have one or the other (but not both), even if the reports with both observations are further from the full hour. In cases where observations only have temperature or dewpoint temperature (and never both), then those with temperature are favoured, even if these are further from the full hour (00 min). All variables in a single HadISD hourly time step always derive from a single ISD time step, with no blending between the various within-hour reports. However the HadISD times are always converted to the nearest whole hour.

However, this can result in that the selected report may not include all metrics, and so there are gaps for that timestamp in the HadISD.  For precipitation variables, when summing to daily, monthly, or annual totals, this will result in an apparent undercatch, where totals are lower than derived from other data sources (e.g. GSOD, also based on ISD).  We've also been made aware that the logical QC check being applied to the precipitation data is not always working as intended - so it may be worth looking in the flagged_values field of the netCDF files if something looks awry.

Finally, in case you'd not seen, version 1.0.0 of GHCNh is available for download at NOAA.

Monday, 21 October 2024

HadISD v3.4.1.202409p

The update to HadISD v3.4.1.202409p has just been released, now that the data services at NOAA NCEI are back online following the flooding from Hurricane Helene.  Although many files are updated through to 30 September 2024, it is possible there are some data gaps resulting from missing ingested data.  NOAA NCEI are working through these, but it could take a while for all data gaps to be filled.  More may be apparent in the next release (v202410p).

It is also not yet clear if the date scheduled for the termination of updates to the ISD (31st October 2024 as last I heard) will now move later.  We intend to continue updating HadISD for as long as updates are appended to the ISD.

Tuesday, 8 October 2024

Delays to HadISD updates

Following Hurricane Helene's passage over North Carolina, the extensive flooding in the Asheville area has caused an outage of some of the NOAA-NCEI websites and datasets.  This means that the update to HadISD due early October 2024 (v3.4.1.202409p) will be delayed until these services are up and running again.

Wednesday, 8 May 2024

Looking towards GHCNH

Last week NCEI announced the release of the GHCNH (Global Historical Climate Network Hourly) dataset:

https://www.ncei.noaa.gov/news/next-generation-climate-dataset-built-seamless-integration

The GHCNH replaces the ISD, and as such I'm still expecting the ISD to be turned off in the next few months.  This will obviously result in the HadISD having no further updates.  

As many of the QC tests being applied in GHCNH are based on those in the HadISD, it does not make sense to pass the GHCNH data through the HadISD QC system. Therefore the HadISD in its current form will transform to a static dataset, and at some point in the future, will be retired and archived (though this is some time off!).

At the moment there is no plan to immediately work on a wrapper for the GHCNH data and release in a "HadISD" format. However this may change in the future as we move to using GHCNH in other systems as well.

We'll post updates on this blog over the next months during the transition from ISD to GHCNH.

Monday, 15 January 2024

HadISD v3.4.0.2023f & future look

We released updated versions of HadISD, and this time two versions have been released at the same time.  As described in this post, we noted that the buddy/neighbour checks had not been running since 2018.  We have released a version of HadISD which correctly implements these checks as intended (v3.4.0.2023f), but for those who may wish to do their own comparison or use a version where these checks are absent as per the last few years of updates, then v3.3.1.202312p is also made available.

As we noted in our earlier post, the missing buddy checks also affect some of the other QC checks - predominantly those where a comparison with neighbouring stations can lead to flags set being removed. The Odd Cluster (Fig 1) and Climatological (Fig 2) checks show clear increases in the fractions of observations flagged by these checks across most stations.

Fig 1: Odd cluster checks for Dewpoint. Top - v3.3.1.202312p, Bottom - v3.4.0.2023f

Fig 2: Climatological Outlier checks for Tempeature. Top - v3.3.1.202312p, Bottom - v3.4.0.2023f

Although there is a general increase in the amount of observations flagged, most of these are in the lowest categories of fractions of the total record (to be expected).  We also expected changes in the flagging rates for the Distributional Gap check, but saw only very slight differences.

The other test with a clear impact is that of Dewpoint Depression (Fig 3).


Fig 1: Dewpoint Depression checks. Top - v3.3.1.202312p, Bottom - v3.4.0.2023f

Future Look

As noted in another earlier post, the ISD will be pausing updates during 2024.  The timeline for this is now looking like end March 2024 rather than being December 2023, and we'll post on here when we get further details.  In the meantime, we will continue HadISD updates (under v3.4.1.2024XXp) until ISD updates cease.


Wednesday, 11 October 2023

Pausing HadISD updates in 2024

The HadISD dataset builds on NOAA NCEI's ISD dataset. There is work underway to replace the ISD with a new GHCNh (Global Historical Climate Network Hourly) product at NOAA, which will sit alongside the existing daily and monthly products under the GHCN brand.

As a result of this, when the ISD is no longer operationally updated, the HadISD will also cease to be updated.  Once this happens (likely at the end of this calendar year - the original notice from NOAA is already out of date) we will produce a final version of the HadISD and leave this available for some time on the home page.  A version will also be lodged at CEDA as usual.  This will allow any monitoring occurring on a calendar-year basis to happen on a complete dataset.

In due course we may look into the new GHCNh product to see whether we can build a "HadGHCNh" product from that.  Many of the quality control tests are similar in this new GHCNh and so we will need to do some careful investigation to ensure we are not erroneously keeping bad or removing good values if we apply the HadISD QC suite on top of these already QC'd data.

Next steps

Given the issues with the buddy check described in a previous post, we intend to release two versions in early 2024:  

  • v331_202312p which follow on from other versions, with the buddy checks not being applied
  • v340_2023f where we will reinstate the buddy checks.
Thereafter updates to HadISD will cease for the foreseeable future. 
 
We hope the approach of these two releases will give clarity and consistency to users of HadISD, and also enable us to perform some further investigations on the impacts of the inclusion of the buddy checks (and corrected unflagging steps) on the data at this point.  Users can also ensure they pick a dataset version which is consistent with any other approaches they have done. It also means that those who are using HadISD for climate monitoring can assess the calendar year 2023 and then have time to plan to use GHCNh.
 
As always, if you see anything untoward in the HadISD, do let us know!

Bug in the Buddy Checks

We have recently the noticed that the checks using the neighbouring stations in the HadISD are not running as intended, and are setting no flags at all (see Fig. 1 and also e.g. v331_202309p_Buddy_check).  It appears this has been the case since v202_2017p in 2018!  Although the initial releases of version 2 did include buddy checks, adaptations to run on a new job management system resulted in an bug where the data being read in for the buddy station was identical to the target station being assessed.  Unfortuntately we have only just picked this up.

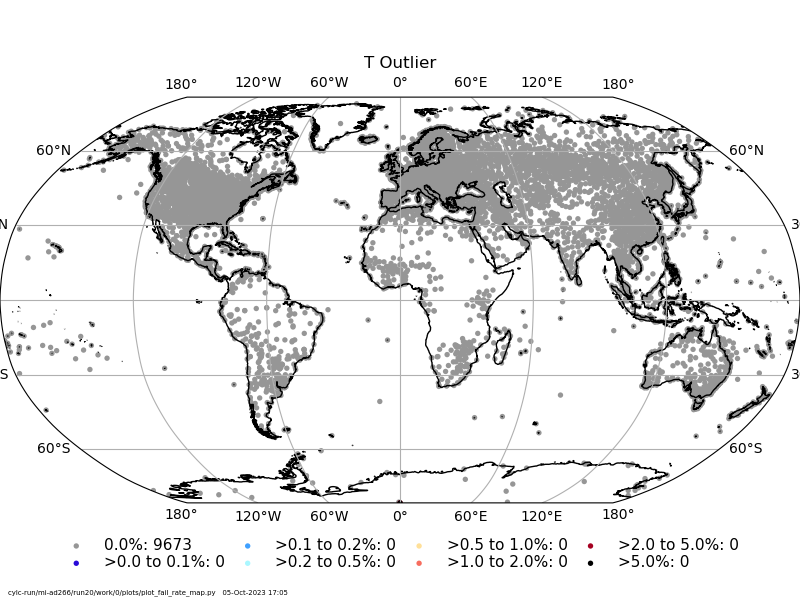
This error affects the temperature, dew point and sea-level pressure variables which would use the buddy check to identify further spurious values.  We show differences between v201_2016f and v202_2017f in Fig. 1 (to keep changes to station counts to a minimum), which clearly demonstrates the effect of this error.  Although the majority of stations would only have had a few observations (<0.1% of the total in their record) flagged by this test, it is pervasive across all continents.

https://www.metoffice.gov.uk/hadobs/hadisd/v201_2016f/images/All_fails_TOT_20170330.png

https://www.metoffice.gov.uk/hadobs/hadisd/v202_2017f/images/All_fails_TOT_20180314.png
Fig. 1: Flagging rates for temperature neighbour check, Top - v201_2016f, Bottom - v202_2017f

Also, the neighbours are used to help unset some flags (tentatively) identified by earlier checks.  If there are insufficient neighbours, no unsetting occurs.  However, where there are enough neighbours, then as these contain identical data to the target station unflagging occurs as the observations from the neighbours appear to be a sufficiently good match.

This affects the climatological (temperature & dew point), distributional gap (temperature, dew point & SLP), odd cluster (temperature, dew point & SLP but not wind speed) and dew point depression checks.  The greatest reduction in numbers of observations flagged by any test are in the odd cluster and dew point depression checks (see Figs. 2 & 3) with lesser impacts in the climatological, and minor ones in the gap check.

https://www.metoffice.gov.uk/hadobs/hadisd/v201_2016f/images/All_fails_OCT_20170330.png

https://www.metoffice.gov.uk/hadobs/hadisd/v202_2017f/images/All_fails_OCT_20180314.png
Fig. 2: Flagging rates for temperature odd cluster check, Top - v201_2016f, Bottom - v202_2017f

https://www.metoffice.gov.uk/hadobs/hadisd/v201_2016f/images/All_fails_DPD_20170330.png

https://www.metoffice.gov.uk/hadobs/hadisd/v202_2017f/images/All_fails_DPD_20180314.png
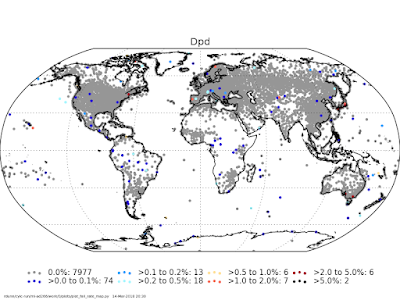
Fig. 3: Flagging rates for dewpoint depression check, Top - v201_2016f, Bottom - v202_2017f

In terms of the impact on the dataset as a whole, the absence of the buddy checks along with the additional erroneous unflagging means that the data are not as clean and quality controlled as we had hoped (and have been stating).  We extend heartfelt apologies to all users.

However, there are no other impacts on the data other than some erroneous values are not being flagged that should be.  Although the set of automated QC tests applied to the HadISD would never have been a perfect system, we're sorry that it has not been running as effectively for the last few years.  The way the QC suite was designed is that individual observations can be flagged by many different tests.  Therefore, although some tests are not working as we had intended, in many cases, erroneous observations will be being flagged by other tests. The overall flagging rates across all tests are very similar (Fig. 4), but depending on the application, those values which are currently retained in error may be important. 

https://www.metoffice.gov.uk/hadobs/hadisd/v201_2016f/images/All_fails_ALL_Td_20170330.png

https://www.metoffice.gov.uk/hadobs/hadisd/v202_2017f/images/All_fails_ALL_Td_20180314.png
Fig. 4: Flagging rates for all dew point checks combined, Top - v201_2016f, Bottom - v202_2017f

As the dataset has been run with this error for a number of years (since 2018), we have decided to continue updates as they have been, i.e. without the buddy checks running, at this point in time for consistency with previous releases.  Given the pause to HadISD updates in early 2024 (see separate post), there are reasons for this approach.

Next steps

Given the issues with the buddy check described here and the forthcoming pause to HadISD updates, we intend to release two versions in early 2024:  

  • v331_202312p which follow on from other versions, with the buddy checks not being applied
  • v340_2023f where we will reinstate the buddy checks.
We hope this will give clarity and consistency to users of HadISD, and also enable us to perform some further investigations on the impacts of the inclusion of the buddy checks (and corrected unflagging steps) on the data at this point.  Users can also ensure they pick a dataset version which is consistent with any other approaches they have done.


Wednesday, 6 September 2023

Correction to T_wet calculation in the humidity files

Following the change to the formula used in HadISDH to calculate the wet-bulb temperature (see details on the HadISDH blog) we updated the forumla used for the humidity data files in HadISD for versions v3.3.0.2022f onwards.

It has recently come to our attention that in doing so we introduced a bug into how this updated formula was being called, and so the Twet values for versions v3.3.0.2022f to v3.3.1.202307p were incorrect (an ice bulb vapour pressure was being used in the call to the routine).  This has now been corrected in v3.3.1.202308p.

Wednesday, 15 June 2022

Calm winds in ISD, HadISD and GSOD

This post summarises an issue found earlier this year in the representation of calm periods (0 m/s) in the wind speed fields of ISD.  For full details, see our recently published paper on this at Environmental Research Communications.

We noted that in plots of the regional (and global) average wind speed, used in the BAMS State of the Climate report, that there was a significant inhomogeneity especially in Asian regions, see Figure 1, and wanted to understand the cause.

Fig 1: Time series of global and regional annual average wind speeds taken from stations in the HadISD.  For more details see Dunn et al, (2022) and the Surface Winds section in the BAMS State of the Climate.

The inhomgeneity is more prominent when looking at the calm fraction (percent of non-missing observations which measure 0m/s), see Figure 2. The drastic reduction for the two Asian regions, and also over Europe in 2013 is unlikely to be a natural feature of the climate at that date.
Fig 2: Time series of global and regional annual calm fraction taken from stations in the HadISD.
In looking more deeply at example stations, we noted that after 1 May 2013, there were no periods of 0m/s wind speed in the station time series in HadISD (Figure 3).  And this is a wide spread issue for stations across the globe (Figure 4).
Fig 3: Sub-daily wind measurements for the HadISD station 226760-99999 over its complete record.  [Sura, Russia, 63.58 N, 45.63E, 62.0m a.s.l.]

Fig 4a: Calm fraction for 2012

Fig 4b: Calm fraction for 2014
By tracing this back, we found this was also the case in the ISD, suggesting it has not been noticed, and affects all downstream products of the ISD (including HadISD and GSOD, the Global Summary of the Day). Investigations by our colleagues at NOAA/NCEI and their contacts in the USAF Weather Squadron found the issue as being an error in how calm winds were encoded in their outputs from the GTS.  This started on 1st May 2013, and has been corrected from 15th March 2022 going forwards.  Work is being done to correct the intevening years, and release that data into the databases, but this is still being done.

In HadISD, we can use the measurement flag which is in the ISD data files to recover calm periods assigned as missing.  This could also recover true missing data where the measurement flag has been erroneously given the value of calm, but we beleive this to be a small fraction of the observations.

By applying this simple correction to HadISD, we recover calm periods in stations between 2013 and 2022.  For those who use surface winds in their analyses, the addition of these calm periods (which used to be represented by missing data) will reduce the average wind speeds over this time range.  We show in Figure 5 how this impacts the global and regional time series, when compared to Figure 1.  There is a reduction in the magnitude of the reversal in global average surface wind speeds, which has been observed since around 2010.


Fig 5: Time series of global and regional annual average wind speeds taken from stations in the corrected HadISD.

There are other studies using independent data sources which reproduce both the long term decline of wind speeds since the beginning of the bulk of the HadISD records (1973) until around 2010, and also the slight reversal in global wind speeds since that date.  However, by including these previously missing calm periods means the magnitude of this reversal is reduced by around 30%.

For more details, please read the paper linked below (Open Access) or get in touch.

Reduction in reversal of global stilling arising from correction to encoding of calm periods, Dunn, Azorin-Molina, Menne, Zeng, Casey & Shen, ERC, 2021, https://iopscience.iop.org/article/10.1088/2515-7620/ac770a

Wednesday, 9 February 2022

HadISD 3.3.0.202201p

A new year and another larger version change.  

The final version for 2021 (v3.2.0.2021f) was released in January, and is now also available at the CEDA Archive.  We have released the first preliminary version for this calendar year, v3.3.0.202201p.

A couple of bugs have come to light over the last month, which means this new version is has a larger version increment than normal.

Record Check

A user pointed out that the record check was failing known records for stations in the Middle East.  This was due to the HadISD code using the values for the temperature records available at Arizona State University for just continental Europe, rather than the area reflecting WMO Region VI.  This has been fixed in the latest run.  We've also updated the values used by this check to account for recent extreme events which have set new records.

Calm Periods

We noticed that calm periods, especially for stations in Asia and parts of Europe, were not being correctly converted from the ISD because of a change in encoding for these measurements which started in mid-2013.  We have been in contact with NOAA/NCEI who maintain the ISD to find out what occurred.  However, as a interim we have adjusted how calm periods are read in from the ISD so that these are now correctly presented.  We hope to be able to give further details on this change, how it arose and its implications in due course.


Monday, 20 September 2021

Adapting the QC to account for the June 2021 North American Heatwave (part 3)

We have seen in parts 1 and 2 that the Climatological and Distribution checks have been adjusted because some values at some stations were likely being erroneously flagged during the heatwave over North America in June 2021.

In order to see how much of an effect these updated checks have had on the flagging rates, we look at a spatial distribution of the stations during the last days of June 2021 showing the temperatures at each station, with observations flagged with our unmodified QC appearing in green (Figure 1). As is clear, a large number of stations are flagged during this time. 

Figure 1.  Temperatures at HadISD stations on 28-June-2021 at 00:00UTC (17:00PDT on 27th June).  Flagged stations are shown in green, and non-reporting as transparent.


We produced the same map after the modifications in the two QC tests, and also the appropriate adjustment to the buddy check to allow any tentative flags to be unset (Figure 2).  Many fewer stations are flagged with these updated tests.  However, a number are still flagged.  These are flagged throughout the period of interest rather than during the hottest part of the day, and so were likely the result of a test which flags an entire month. After some spot checks on these stations, these flags are from the excessive variance test.

Figure 2.  As for Figure 1 but after updated QC tests.

The excessive variance test looks at the distribution of the within-month variance, and identifies months with exceptionally low or exceptionally high variance.  The scaling used for this test is the interquartile range, and months which have a variance more than 8 IQR from the average are flagged. As can be seen for the example of Osoyoos (712150-99999,  latitude 49.033, longitude -119.433), the variance for June 2021 is much larger than any previously seen June (Figure 3).

Figure 3.  The Variance Check for Osoyoos (BC, 49.033, -119.433) showing the all of June 2021 flagged.

The variance check uses a fixed threshold of 8 IQR rather than thresholds generated from the properties of the distribution (as in the climatological and distribution checks).  To update this check to determine thresholds from the distribution itself (as in the e.g. climatological and distributional checks) would be a larger change than the relatively small ones we have done so far. Also, in the example in Figure 3, a reasonable threshold determined from the distribution may still have excluded June 2021 (note, the y-axis is a log-scale) and we might struggle to be objective in this change if tailoring to this specific event, perhaps causing issues in other regions. In contrast, the changes in the climatological and distributional checks were easily motivated (and perhaps should have been spotted during development of the monthly updates).

As we noted in the HadISD papers, the automated QC is a balance between removing erroneous/dubious observations but retaining true extremes, and what we do not want to do is make changes with inadvertently large impacts elsewhere.  Our plan at this point in time is to note this as an issue for this test (and event) to look at in the future in any next major update to HadISD.  Any flagged data in HadISD is removed from the netCDF data fields, but remains available within the netCDF files should users wish to access it.  If you have thoughts on this, please do get in touch or comment below.

The next update to HadISD (in October 2021) will show a version number increment to reflect these changes in the QC tests (3.2.0.202109p).

[Animations of three days of the heatwave showing the flagged stations before and after the QC test updates are available on the HadISD homepage].

Tuesday, 14 September 2021

Adapting the QC to account for the June 2021 North American heatwave (part 2)

Continuing this took longer than planned, so there has been another version release of HadISD (v3.1.2.202107p) in the meantime.

In the last post, we went through the changes that were made to the Climatological Outlier check as a result of the temperatures experienced in North America in June 2021.  Since then, there have continued to be heatwave events across the world, with temperatures and impacts around the Mediterranean being the current focus (at time of writing).  We will continue to use the North American heatwave for these changes for consistency, but note that of course changes to our QC will affect all stations and variables, and hence events.

Distributional Gap Check

In this check there are in fact two. The first uses monthly aggregated data, to look for asymmetries in the distribution, and we haven't changed that one.  The second is what we delve into here, which uses all observations within a calendar month, and identifies gaps in this distribution to decide where to flag.  We'll use the same station for our plots as in the previous post, 711130-99999 (Agazziz, BC, Canada).

As we use a very similar approach in this test, we also had the same issue where our diagnostic plots initially were not showing data from the incomplete calendar year.  But that was an easy fix, see Figure 1.

Fig. 1  the distribution of scaled anomalies for June from Agassiz (711130-99999), with the flagged ones highlighted in red.  Distribution from all years before 2021 is in black, and from all years including 2021 in grey. Blue is the fit to the data including skew and kurtosis using Gauss-Hermite polynomials. Note the logarithmic y-axis. 

Here again, a handful of observations were being flagged because they fall beyond the bulk, but only when ignoring others from the incomplete calendar year.  What we also noted was the single observation at the low end being flagged.  This test should look for gaps at least two bin-widths wide (so two consecutive empty bins), and this doesn't seem to have been the case.  We fixed that at the same time as the other changes.

As for the climatological check, we treated the complete and incomplete years separately, which meant that these observations were now tentatively flagged, which can be unset by the neighbour check (Figure 2).

Fig 2. Same as Fig. 1, but with the data from June 2021 now being correctly marked as tentatively flagged.  Orange vertical lines are derived from the fit of the distribution (blue) to complete years only (black), and red ones are where a gap has been found.  The Purple and Pink are derived when including the final month.

The final thing that we wanted to change was the nature of the curve being used to fit the distribution.  When putting this code together, we wanted to include skew and kurtosis, as the distributions were clearly non-gaussian.  At the time, we used Gauss-Hermite polynomials to obtain the fit with these higher moments of the distribution.  However, we have since found that these sometimes have artefacts which result in some "wiggles" in the distributions (see Figure 1).  Although this approach is still useful for gauging where to start looking for gaps in the distribution, but we thought that this was an opportunity to see what else could be done.  We tried using the same skewed distribution (no kurtosis) as for the climatological outlier check.

Fig. 3: Same as Fig. 2, but now using a skewed-Gaussian ditribution for the fit rather than the Gauss-Hermite polynomials.

For this month, it is a more sensible fit, and also has a co-benefit of moving the value from which this test starts searching for a gap to the right, and so includes all of the hot temperatures in June.